With an estimated 38,300 people losing their lives and close to four and a half million getting injured on America’s roads last year alone, knowing which states and counties are most dangerous and which are safest actually makes a lot of sense.
In order to come up with some numbers, the folks at Auto Insurance Center analyzed over 777,000 fatal accident records from the last 20 years, provided by the NHTSA’s Fatality Analysis Reporting System.
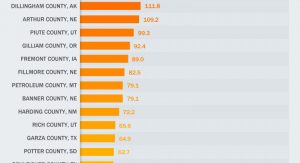
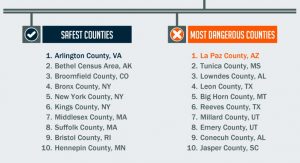
If you want to go by county, the safest place you can actually be while driving your vehicle is Arlington County, Virginia, which is also considered one of the richest counties in America. On the opposite side of the spectrum is La Paz County, Arizona, which ranks as the absolute most dangerous county for fatal crashes.
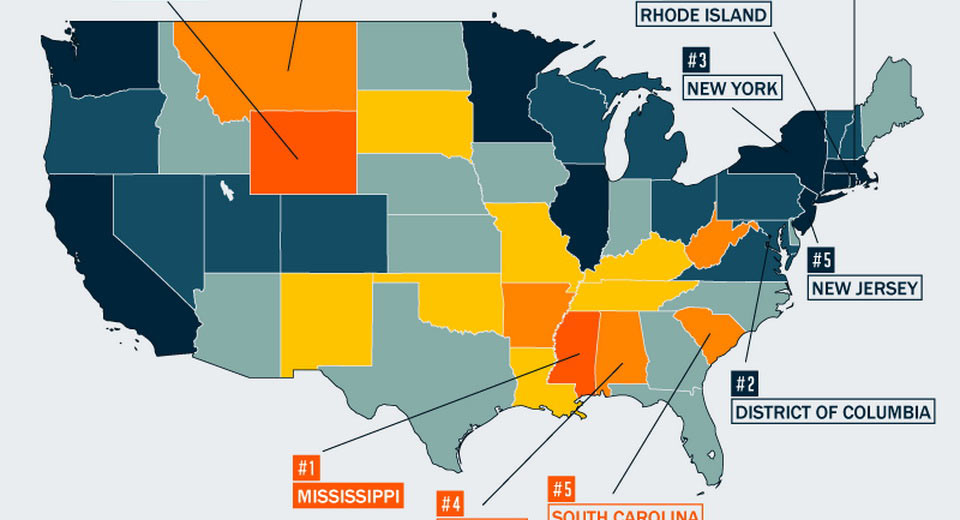
Looking at the results on a state by state basis, the top 5 most dangerous are Mississippi, Wyoming, Montana, Alabama and South Carolina, in this exact order.
The safest ones are Massachusetts, District of Columbia, New York, Rhode Island and New Jersey – though if you look at the map, it seems that on average you’ll be moderately safe towards very safe as long as you don’t live in Arkansas, Tennessee, Kentucky, West Virginia, Missouri, Oklahoma, New Mexico, plus of course the previously mentioned top 5 most dangerous.
According to the NHTSA, Massachusetts has the lowest rate of traffic fatalities in the past 20 years. One of the reasons for this could be good public transportation. Another factor may be the default speed limited on major highways in these Northeastern states where authorities typically enforce 55 to 65 mph (88 to 104 km/h) limits on urban and rural interstates – whereas states in the South and West generally allow top speeds of 70 to 75 mph (112 to 120 km/h).
Overall, the number of traffic fatalities per 10,000 people has decreased in the past 20 years, going from 1.59 to 1.09 in 2015. Also during the same period, North Dakota had by far the greatest increase (77%) in fatal crashes, whereas DC, Vermont and Iowa showed the largest decreases at roughly 60%, 46% and 39% respectively.
If you want to read the full study, you can do so by simply clicking this link here.


