Electric vehicles still only account for a small percentage of overall vehicle sales in the U.S. but their market share is growing rapidly and has increased from 2.7 percent to more than 6 percent in the past two years.

But one factor that might be persuading some buyers to make the switch, and others to stick to ICE power, is the availability of charging stations in their city and state. No one buys a gasoline-engined car and worries where they’ll be able to fill it up, but some regions in the U.S. are far better covered for EV charging than others.

Related: Mercedes To Launch Global Charging Network Open To All Brands Starting In North America

ISeeCars analyzed America’s charging infrastructure to work out which cities and states offer the best access to charging points, and also which came off worst. The team looked at both snail-pace Level 2 chargers and fast Level 3 DC chargers as well as separating Tesla and non-Tesla networks. Tesla has announced it will open up its network to drivers of other cars, but it’s only offering access to a small portion of its charging infrastructure.

Most EV-Friendly Metro Areas
RankMetroResidents per ChargerTotal Chargers
1San Francisco-Oakland-San Jose, CA46514,083
2San Diego, CA8243,450
3Los Angeles, CA85218,287
4Denver, CO9924,128
5Fresno-Visalia, CA1,0241,692
6Kansas City, MO1,0632,101
7Sacramento-Stockton-Modesto, CA1,1113,481
8Boston, MA-Manchester, NH1,1115,366
9Baltimore, MD1,2342,119
10Seattle-Tacoma, WA1,2993,744
National Avg2,280146,160
SWIPE

Some of the results proved entirely unsurprising: looking at the charging stats including Tesla and non-Tesla chargers, five of the top 10 EV-friendly cities are located in California, and the most EV-friendly metro area was San Francisco-Oakland-San Jose, which has a total of 14,083 chargers, equating to one for every 465 residents. But Denver, CO, which came fourth with one charger for every 992 residents and sixth-placed Kansas City (one charger per 1,063 residents) both massively outperformed the national average of 2,280 residents per charger.

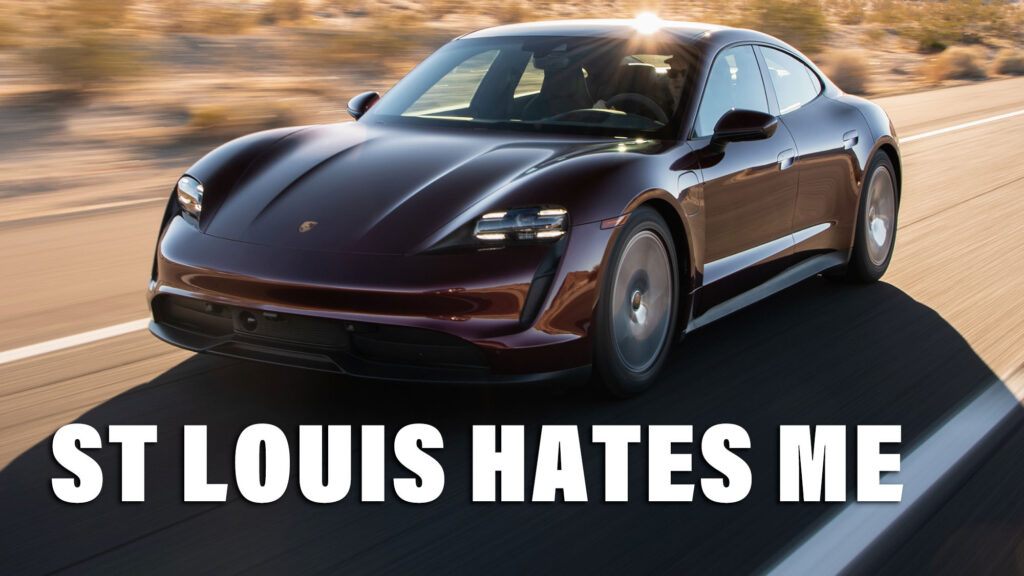
But we pity anyone in St Louis, MO, who buys an EV with a short range and doesn’t have a charging socket at home. There are only 473 chargers in the entire city, meaning each charger is shared by 5,787 residents. Birmingham, AL, has even fewer chargers – just 296 – but its residents-per-charger ratio isn’t quite as bad at 5,691.

Comparing the figures for chargers (including Tesla chargers) at a state level shows that California has 44,287 chargers to Vermont’s laughable 920, but the Green Mountain State’s tiny population means it has one charger per 703 residents while 881 Californians have to share each plug. At the other end of the scale Mississippi has only 317 chargers, each shared by 9,275 inhabitants.

Least EV-Friendly Metro Areas
RankMetroResidents per ChargerTotal Chargers
1St. Louis, MO5,787473
2Birmingham, AL5,691296
3Indianapolis, IN5,422491
4San Antonio, TX5,386464
5Cleveland-Akron (Canton), OH5,217635
6Louisville, KY5,194302
7Milwaukee, WI5,092378
8Houston, TX4,4541,448
9Greensboro-Winston Salem, NC4,153387
10Dallas-Ft. Worth, TX3,5812,024
SWIPE

The numbers are slightly different if you switch the focus to fast chargers, California switching places with Vermont, and Kentucky propping up the states tables, while last-placed metro area, Louisville, KY, offers one charger for every 35,648 residents compared with one per 2,444 in first-placed Fresno-Visalia, CA.

But these figures all include Tesla chargers, remember. Cut them out of the equation and the picture is pretty stark away from the west coast. Louisville has just eight non-Tesla fast chargers, or one per 196,063 residents, although Oklahoma City, OK, does buck the west-coast-centric picture, topping the metro table with one fast charger for every 5,962 residents.

To check out ISeeCars‘ full report and the complete metro and state rankings for Tesla and non-Tesla charging points, click here.

US States Ranked by Residents per Charger (including Tesla Network) As Of 2022

RankStateResidents per ChargerTotal Chargers
1Vermont703920
2California88144,287
3Massachusetts1,1675,981
4Colorado1,2894,530
5Rhode Island1,462748
6Maryland1,5244,044
7Hawaii1,574915
8Maine1,602865
9Oregon1,7172,469
10Washington1,7304,500
11Utah1,8021,876
12New York1,95010,089
13Nevada1,9771,607
14Connecticut2,1231,708
National Avg2,280146,160
15Virginia2,5163,452
16Georgia2,6554,110
17Missouri2,7172,274
18Arizona2,7502,676
19Kansas2,7551,066
20Wyoming2,809207
21Delaware2,821361
22Florida2,9117,641
23New Hampshire2,950473
24New Jersey3,2282,869
25North Carolina3,3983,149
26Michigan3,7042,709
27Oklahoma3,7291,078
28Minnesota3,7661,518
29Pennsylvania3,8923,333
30Illinois3,9383,195
31New Mexico3,995529
32Ohio4,1632,824
33Tennessee4,1721,690
34Nebraska4,354452
35Montana4,386256
36Texas4,5976,533
37North Dakota4,611169
38Iowa4,659687
39West Virginia4,837367
40South Dakota4,918185
41South Carolina5,0121,054
42Arkansas5,018607
43Idaho5,171375
44Wisconsin5,3131,109
45Alabama5,991847
46Indiana6,3451,077
47Alaska6,492113
48Kentucky7,349614
49Louisiana9,144502
50Mississippi9,275317
SWIPE

Top 50 Metro Areas Ranked By Residents Per Charger (including Tesla Network) As Of 2022

RankMetroResidents per ChargerTotal Chargers
1San Francisco-Oakland-San Jose, CA46514,083
2San Diego, CA8243,450
3Los Angeles, CA85218,287
4Denver, CO9924,128
5Fresno-Visalia, CA1,0241,692
6Kansas City, MO1,0632,101
7Sacramento-Stockton-Modesto, CA1,1113,481
8Boston, MA-Manchester, NH1,1115,366
9Baltimore, MD1,2342,119
10Seattle-Tacoma, WA1,2993,744
11Austin, TX1,3101,679
12Washington, DC (Hagerstown, MD)1,3374,610
13Salt Lake City, UT1,4931,969
14Portland, OR1,4942,043
15Miami-Ft. Lauderdale, FL1,6912,424
16Hartford & New Haven, CT1,8481,253
17Las Vegas, NV1,8641,097
18Atlanta, GA1,9493,248
19West Palm Beach-Ft. Pierce, FL2,031967
20Columbus, OH2,0831,086
21Phoenix, AZ2,1232,373
National Average2,280146,160
22Raleigh-Durham (Fayetteville), NC2,4531,183
23Orlando-Daytona Beach, FL2,5521,586
24New York, NY2,6017,245
25Jacksonville, FL2,664672
26Grand Rapids-Kalamazoo, MI2,965609
27Nashville, TN2,981898
28Charlotte, NC3,000992
29Chicago, IL3,0322,734
30Norfolk-Portsmouth-Newport News,VA3,033562
31Pittsburgh, PA3,063808
32Philadelphia, PA3,0712,351
33Albuquerque-Santa Fe, NM3,097541
34Oklahoma City, OK3,164537
35Minneapolis-St. Paul, MN3,2321,305
36Harrisburg-Lancaster-York, PA3,351536
37Detroit, MI3,3781,260
38Tampa-St Petersburg (Sarasota), FL3,3811,352
39Greenville-Spartanburg, SC3,429613
40Cincinnati, OH3,465603
41Dallas-Ft. Worth, TX3,5812,024
42Greensboro-Winston Salem, NC4,153387
43Houston, TX4,4541,448
44Milwaukee, WI5,092378
45Louisville, KY5,194302
46Cleveland-Akron (Canton), OH5,217635
47San Antonio, TX5,386464
48Indianapolis, IN5,422491
49Birmingham, AL5,691296
50St. Louis, MO5,787473
SWIPE

US States Ranked By Residents Per Fast Charger In Tesla Network As Of 2022

RankStateResidents per Fast ChargerFast Chargers
1California7,6185123
2Wyoming8,07572
3Nevada11,034288
4Maine11,545120
5Vermont11,98354
6Montana13,36784
7Delaware13,40076
8New Hampshire13,679102
9Connecticut14,165256
10South Dakota15,16460
11New Jersey17,025544
12Arizona17,275426
13Massachusetts17,455400
14Maryland17,973343
15West Virginia18,11498
16Colorado18,481316
17Virginia18,634466
18Oregon18,679227
19Florida18,7881184
National Average19,32317,248
20North Dakota19,48240
21Washington19,912391
22North Carolina21,103507
23New Mexico22,97192
24Utah23,808142
25Georgia24,746441
26South Carolina25,397208
27Iowa25,401126
28Indiana26,080262
29Kansas26,225112
30Pennsylvania26,913482
31Illinois27,000466
32Texas27,0541110
33New York27,254722
34Wisconsin30,851191
35Alabama30,941164
36Minnesota31,762180
37Rhode Island34,17932
38Michigan34,600290
39Nebraska35,14156
40Missouri35,711173
41Louisiana39,571116
42Mississippi40,83472
43Idaho42,15346
44Tennessee44,071160
45Kentucky52,46986
46Ohio59,675197
47Alaska61,13212
48Arkansas64,80147
49Oklahoma111,66136
50Hawaii240,0336
SWIPE