- EV sales surged 11% year-over-year in Q3, with 346,309 units sold, representing 8.9% of the total U.S. market.
- Kelley Blue Book data reveals EV incentives hit an average of 12% in Q3, driving sales growth across the segment.
- Tesla retained its top spot with over 86,000 Model Y sales, followed by GM’s nearly 60% EV sales growth in Q3.
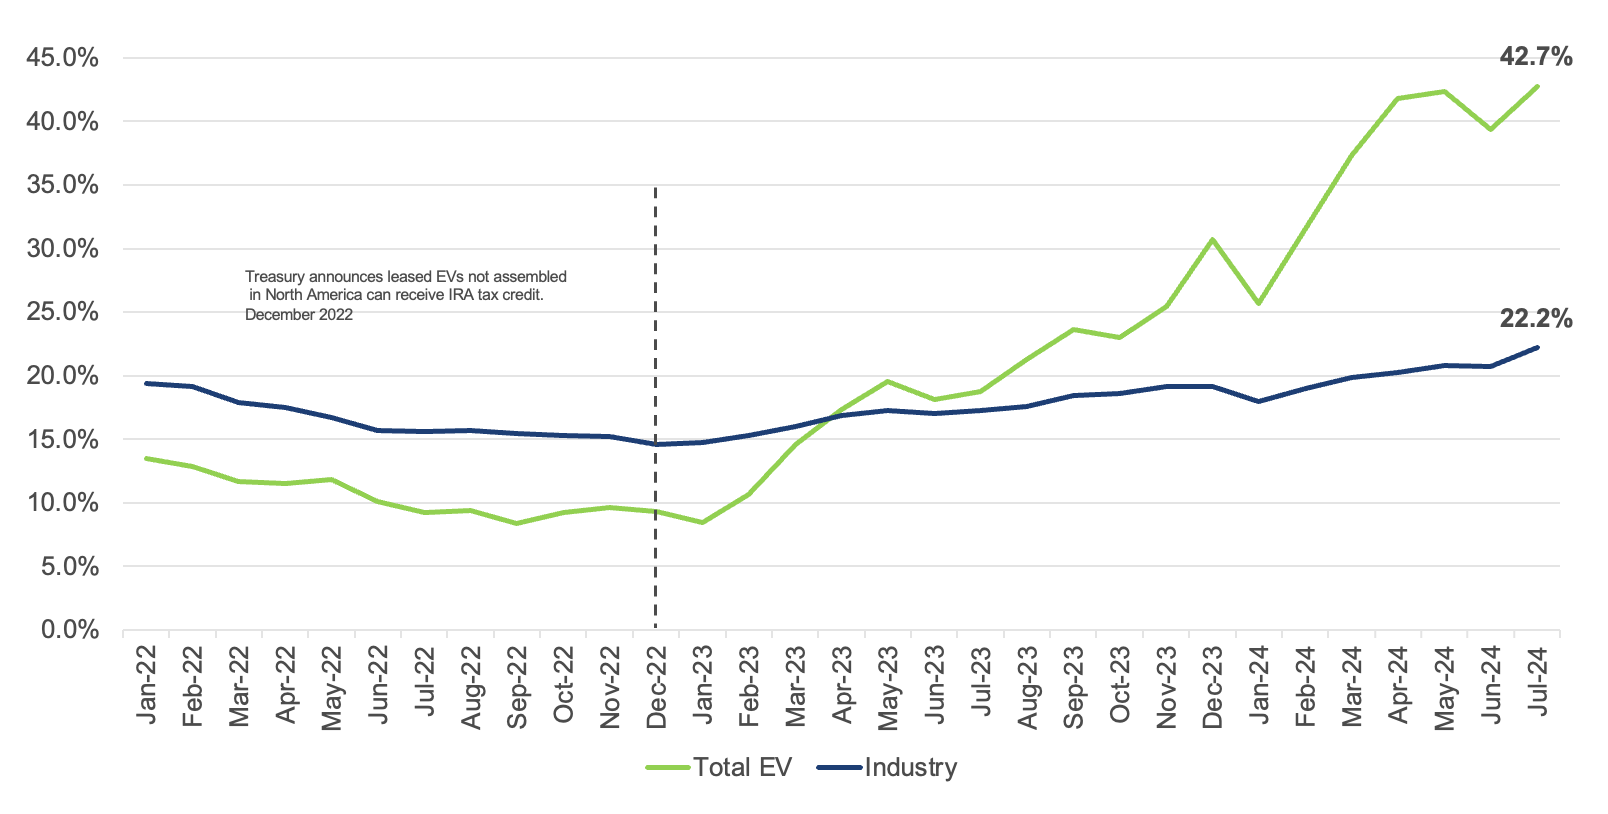
Sales of electric vehicles in the U.S. have made a powerful comeback in the third quarter, surging 11% year over year and reaching an all-time high of 8.9% of the total new car market. This strong rebound signals that while the broader momentum of EV growth has wavered for much of 2024, interest in the segment is far from fading.
Although EV sales have decelerated globally and even in the U.S. for large parts of the year, data from Kelley Blue Book reports that an estimated 346,309 battery-powered models were sold in Q3 2024. That’s a 5% uptick over Q2, driven in large part by aggressive incentives and deep discounts. On top of that, a flood of new, more affordable, and increasingly compelling EV options has helped to keep the market humming along.
Read: New Car Buyers Taking On $1,000+ Monthly Payments At Alarming Rates
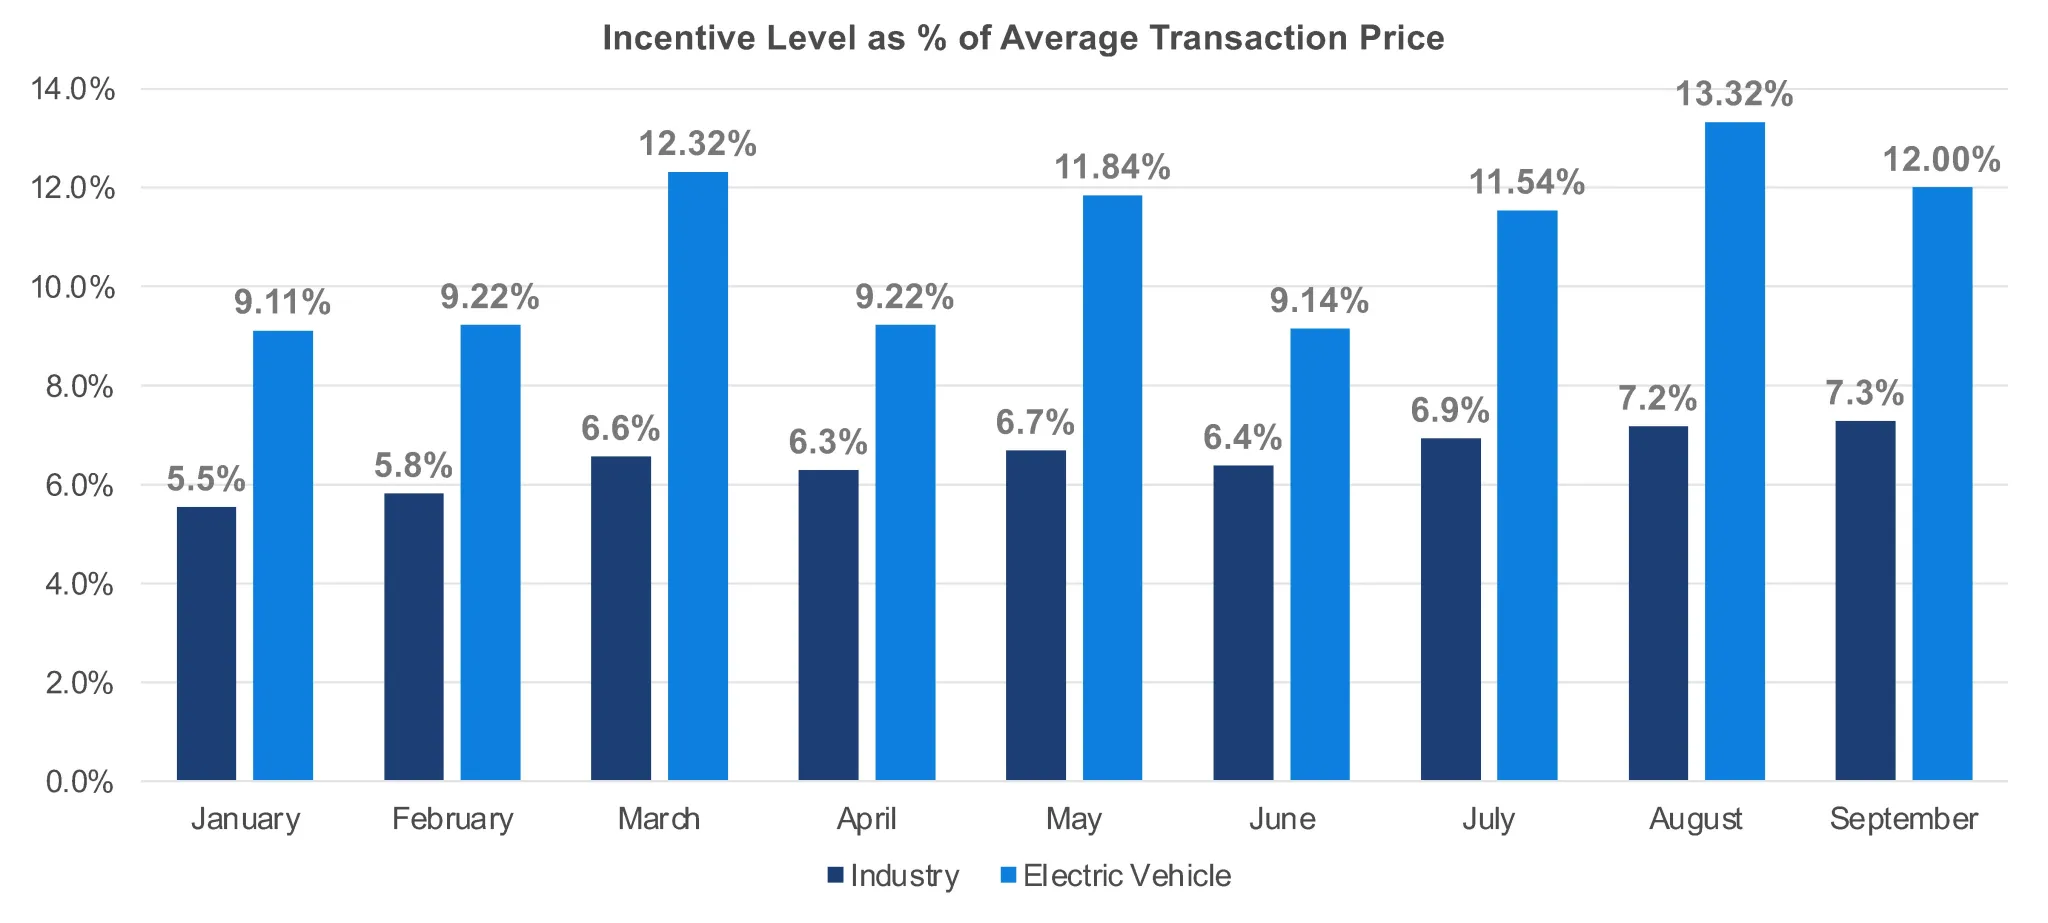
In September, the average incentive for new EVs in the U.S. was 12% of the average transaction price (ATP), significantly higher than the broader industry’s 7.3%. Incentives peaked at 13.32% of ATPs in August and 11.54% in July. These figures were notably higher compared to earlier in the year, when incentives hovered between 9.11% and 9.22% of ATPs during months like January, February, April, and June.
Kelley Blue Book also noted that the ‘leasing loophole,’ which allows carmakers to offer most, if not all, EVs not manufactured in North America with a $7,500 federal EV tax credit when leased, was widely utilized throughout the quarter. The average price paid for an EV in Q3 was just over $57,000 or 19% higher than the industry average.
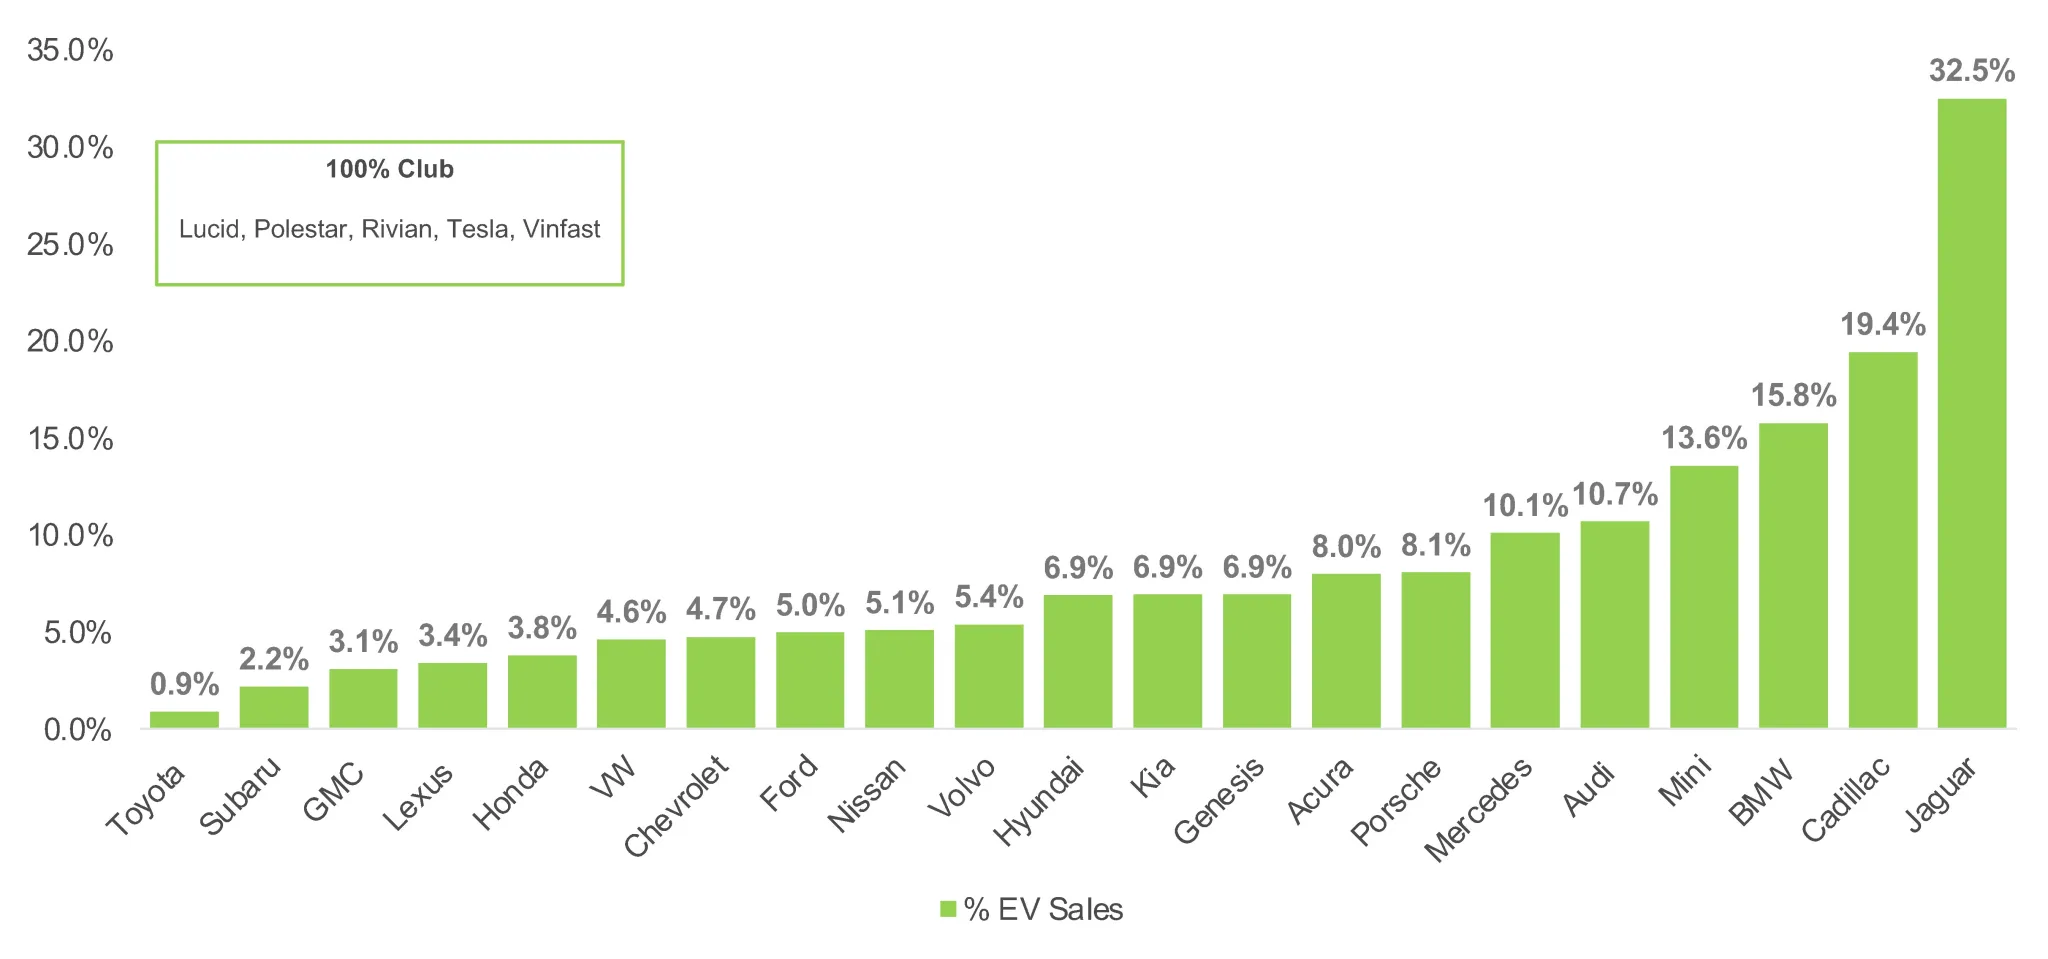
General Motors enjoyed strong sales growth of almost 60% for its EVs in Q3, up to 32,095 units, enough to secure second place behind Tesla (166,923 units) as the largest EV seller in the country. The Hyundai Motor Group fell from second to third as sales remained flat at 29,609 units, while Ford came in fourth with EV sales of 23,509 units.
Tesla sales also rose by a reported 6.6% compared to last year, thanks to the arrival of the Cybertruck. The Model Y remains America’s most popular EV with 86,801 examples sold in Q3, placing it well ahead of the Model 3 with 58,423 units and the Cybertruck with 16,692 units finding new homes.
“While year-over-year growth has slowed, EV sales in the U.S. continue to march higher,” said Cox Automotive director of industry insights, Stephanie Valdez Streaty. “The growth is being fueled in part by incentives and discounts; but as more affordable EVs enter the market and infrastructure improves, we can expect even greater adoption in the coming years.”
Still, the looming question is whether this momentum can be sustained without leaning so heavily on discounts and incentives. While automakers are keeping the pedal down for now, it’s unclear how long they can afford to subsidize sales—especially as the industry faces rising production costs and intensifying competition from new entrants.