- Tesla models have a fatal accident rate nearly twice the industry average, per iSeeCars.
- However, driver behavior, not vehicle design, appears to be behind Tesla’s high fatality rates.
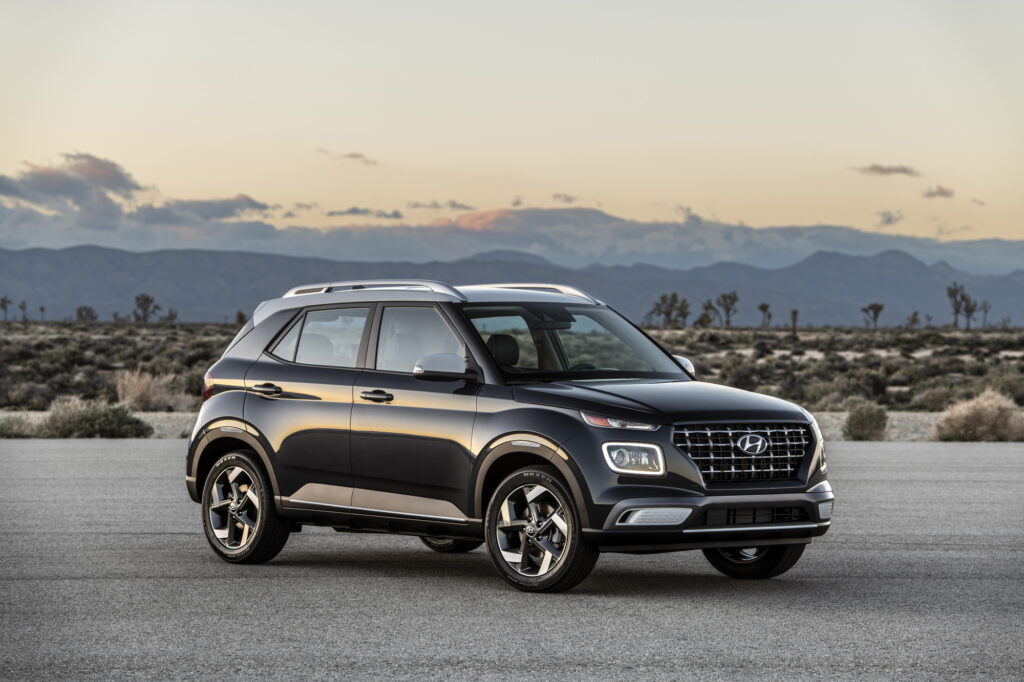
- Hyundai Venue tops the list with 13.9 fatalities per billion miles driven, far above average.
Despite Tesla’s relentless promotion of its vehicles as some of the safest on the road, a new study appears to suggest that the company’s cars may not be as invincible as marketed. The findings, courtesy of iSeeCars, show that Tesla models, in fact, lead the pack in fatal accident rates in the U.S., despite their stellar performance in crash tests. But is it the cars, or the drivers?
Fatal Accident Rates: A Surprising Outcome
The study from iSeeCars analyzed fatality data from the U.S. Fatality Analysis Reporting System between 2017 and 2022. It determined that on average, vehicles from Tesla had a fatality rate of 5.6 per billion vehicle miles. To put that into perspective, that’s higher than brands like Kia (5.5), Buick (4.8), and Dodge (4.4)—and almost double the industry average of 2.9 fatalities per billion miles. It’s hard to reconcile this with Tesla’s branding, where safety is practically a religion, and ergonomics… well, they’re still waiting for their turn.
Read: Tesla’s New Safety Data Claims Autopilot Makes You 8 Times Safer (Maybe)
But before you accuse Elon of exaggerating his cars’ safety credentials, there’s a catch. iSeeCars’ analysts suggest that the high fatality rates “reflect driver behavior as much or more than vehicle design”. In short, it’s the people behind the wheel, not necessarily the technology under the hood, that might be skewing these figures.
Highest Fatality Rates: The Top Contenders
iSeeCars has also compiled a list of the 23 cars with the highest fatality rates, and the results are, well, not exactly reassuring. At the top is the pint-sized Hyundai Venue, with an average of 13.9 fatalities per billion vehicle miles or nearly five times the industry average.
Joining it in the top five are the Chevrolet Corvette and Mitsubishi Mirage (both with 13.6), the Porsche 911 (13.2), and the Honda CR-V Hybrid (13.2). Tesla makes an appearance as well, with the Model Y ranking sixth at 10.6 fatalities per billion miles. Rounding out the top 10 are the Mitsubishi Mirage G4, Buick Encore GX, Kia Forte, and Buick Envision.

The study’s lead analyst, Karl Brauer, points out that many of the vehicles on the fatality list (including the Tesla Model Y) perform admirably in crash tests, offering excellent ratings. So, it’s not that Teslas are inherently unsafe, they might just be in the wrong hands. Risky behavior, inattention, or overreliance on Autopilot could be contributing to the elevated fatality rates.
“Most of these vehicles received excellent safety ratings, performing well in crash tests at the IIHS and NHTSA, so it’s not a vehicle design issue,” iSeeCars executive analyst Karl Brauer said. “The models on this list likely reflect a combination of driver behavior and driving conditions, leading to increased crashes and fatalities.”
Size Matters: Physics at Play
It’s also worth noting that subcompact and compact cars dominate the top of the fatality list, while midsize and full-size cars sit comfortably below the industry average. Why? Well, it’s just basic physics: when a small car collides with a larger one, the smaller vehicle loses. Sometimes and especially in America, it’s not about how safe the car is, it’s about the laws of the universe.


